India's Vanguard moment
Passive investing in India just crossed a structural threshold. Where this leaves a portfolio.

At a family office review last quarter, a senior member of the family asked a question that would have sounded unusual five years ago. They were not asking which fund had outperformed. They were asking the opposite:
How much of our equity book actually needs an active manager at all?1
The question is a small one. The shift behind it is not.
Seventeen Percent and rising
In 2015, passive investing accounted for 1.4% of India’s mutual fund industry. In December 2025, it crossed 17%. AMFI data places passive AUM at over Rs 14 lakh crore, up from Rs 1.91 lakh crore in 2019. That is a 7.3-fold increase in six years, compounding at roughly 40% annually. The category has logged over five years of unbroken positive inflows.
What is happening underneath this number matters more than the number itself.
Passive growth does not move in straight lines. Once a category crosses a certain share of the industry, it stops growing arithmetically and starts growing structurally. Distribution platforms reconfigure around it. Expense ratios compress across the board, not just for index funds. Wealth advisors rebuild their frameworks around it. Each of these forces feeds the next. Once enough advisors recommend it, more AMCs launch it. Once more AMCs launch it, costs fall. Once costs fall, more advisors recommend it. This is the compound dynamic that took US passive funds from less than 20% of fund AUM around 2010 to overtaking active in 2019.
India is now somewhere inside that compound zone.
The push has not come from where most investors assume it has. It has come from a single institutional buyer that does not read fund factsheets. The Employees’ Provident Fund Organisation began investing in ETFs in August 2015, when the Finance Ministry amended regulations to allow it. As of March 2024, EPFO held approximately 9.5% of its Rs 24.75 lakh crore corpus in ETFs. That is roughly Rs 2.3 lakh crore, parked with a buyer that follows a rules-based mandate rather than a market view. The most consequential decision for Indian passive investing was made by the Finance Ministry, not by the AMCs.
Behind that floor, retail demand has accelerated. The Motilal Oswal Passive Survey 2025 found that 68% of Indian mutual fund investors now hold at least one passive product, up from 61% in 2023. Seventy-two percent of surveyed investors plan to increase passive allocations this fiscal year. Eighty-five percent intend to hold their passive funds for more than three years. This is no longer a trading audience. It is an asset allocation audience.
Where this leaves a portfolio
For a sophisticated investor, the more honest question is not whether to participate in this shift. The portfolio probably already does. The question is where in the portfolio passive belongs, and where it does not.
This is where the Indian story diverges from the American one.
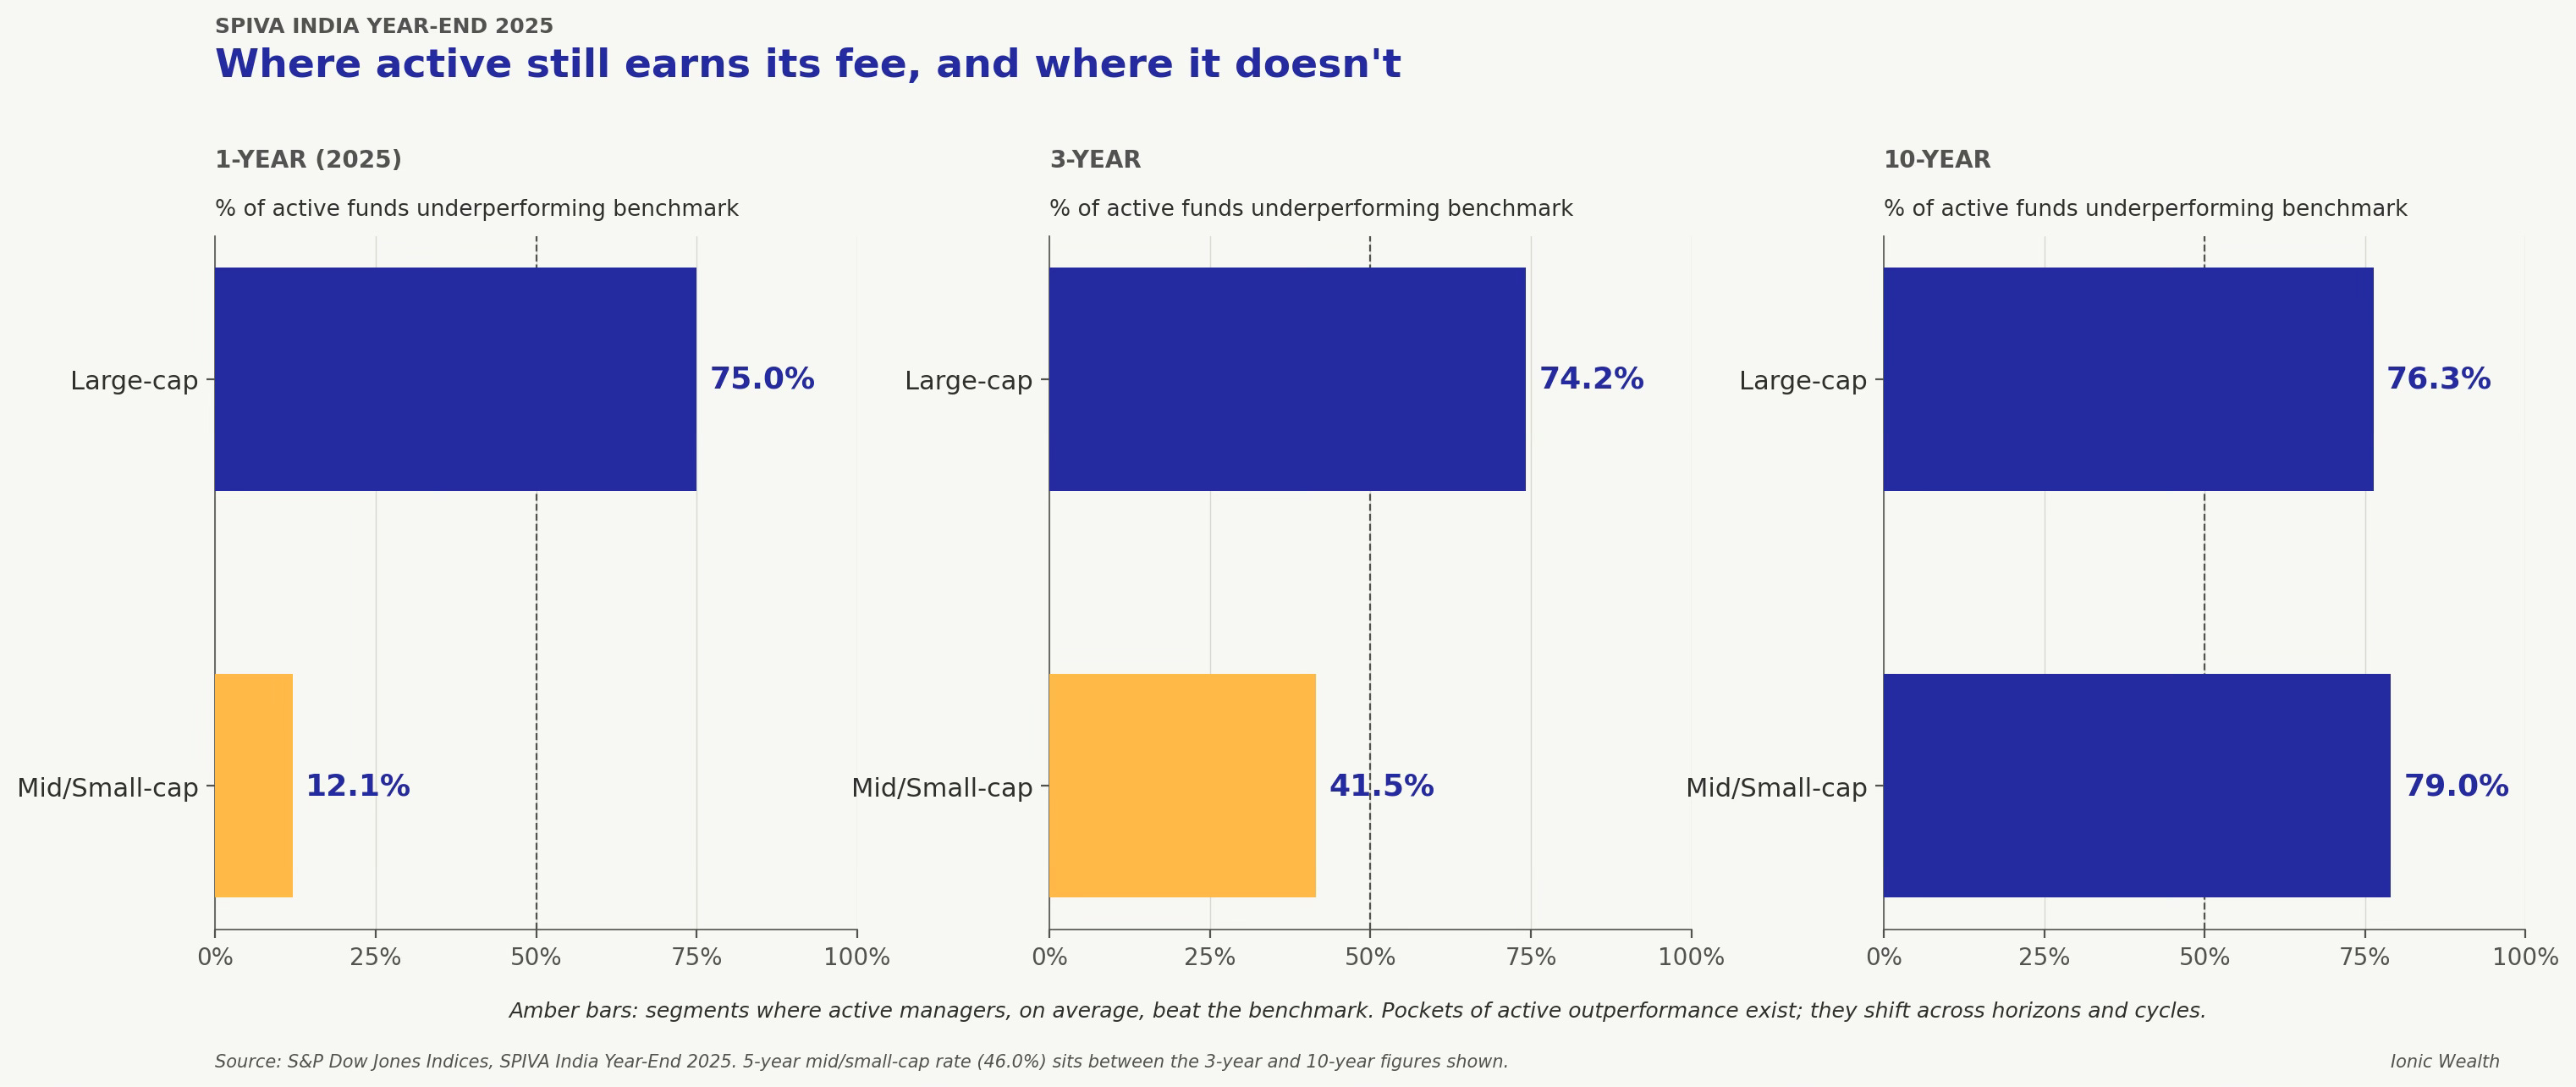
The S&P Indices Versus Active (SPIVA) India Year-End 2025 scorecard, published in early 2026, shows that 75% of actively managed Indian large-cap funds underperformed the S&P India LargeMidCap benchmark in 2025. Over the ten-year horizon, the underperformance rate sits at 76.3%. For ELSS funds, the long-run picture is at least as punishing. In other words, in the most heavily researched, most analyst-covered, most liquid part of the Indian equity market, fewer than one in four active managers beat the benchmark over a decade.
But the same SPIVA scorecard tells a different story one cap-size down. Only 12.1% of Indian mid- and small-cap active funds underperformed their benchmark in 2025, their best relative year since 2014. The three- and five-year horizons show the same pattern in less dramatic form. At the ten-year horizon, the picture converges, with 79% of active funds in the segment still trailing their benchmark.
The data does not draw a clean line between where passive wins and where active wins; it points instead to pockets. There are always parts of the market where inefficiencies exist and where skilled active management can find an edge. Mid- and small-cap appears to be one such pocket today. The 10-year horizon shows these pockets do not stay open forever.
For most portfolios, the takeaway is not a fixed prescription. The data shows that the core of the equity book, the large-cap and large-mid exposure that anchors most portfolios, is where passive vehicles have won the argument over the long term. But the work for an advisor is not to lock the entire portfolio into that observation. It is to identify, across market cycles, where the genuine pockets of inefficiency sit, and where active management can still earn its fee. Those pockets exist. And they move across cycles.
For family offices and UHNI portfolios with more complex books, the principle holds with sharper edges. A lot of Indian UHNI portfolios already carry a concentration the textbook may not anticipate. A founder’s residual stake in an operating business. A second-generation member’s ESOP grant that vested into a single name. Inherited real estate. Pledged promoter equity. The wealth pyramid is built on these.
The J.P. Morgan Private Bank 2026 Global Family Office Report, which surveyed 333 family offices across 30 countries with an average participant net worth of $1.6 billion, places portfolio concentrations among the top six risks cited by family office principals globally (alongside geopolitics, liquidity, trade policy, asset valuations, and economic growth) Concentration is not an Indian-only problem. It is a global family office concern.
The same report shows that public equities are the single largest allocation bucket in family office portfolios worldwide, at 38.4% of capital on average. In India, this is also the bucket where the SPIVA evidence is most punishing for active management.
For a family office allocator, the implication is architectural rather than tactical. The passive core of the liquid equity book acts as a cost-efficient counterweight to the concentration the family is perhaps carrying. A diversified large-cap passive base does two things at once. It captures the equity return at the lowest cost the evidence supports, and it forms a steady foundation against which the family’s existing concentrated exposure can be managed. The mid- and small-cap active satellite remains where conviction can earn its fee. When the operating business or the single-stock position eventually exits, the diversified base is already in place to receive it.
This is the meaningful version of the shift. Not whether passive will dominate Indian wealth management, because in the parts of the market where it should, it already is. The question is whether the portfolio is built to recognise where the evidence sits today, and to adapt when the pockets move.
Back to the family office review. The question that opened this piece, how much of our equity book actually needs an active manager, is not one with a single answer. The answer changes across cycles. But it is the right question to be asking. The data finally supports it.
Fictional composite character. Details have been changed to protect client identity.
Data Sources: AMFI monthly AUM data, Motilal Oswal Passive Survey 2025, Bloomberg Intelligence, Morningstar, Motilal Oswal Passive Survey 2025, EPFO Annual Report (asset allocation as of March 31, 2024), S&P Dow Jones Indices, SPIVA India Year-End 2025 scorecard, J.P. Morgan Private Bank, 2026 Global Family Office Report.